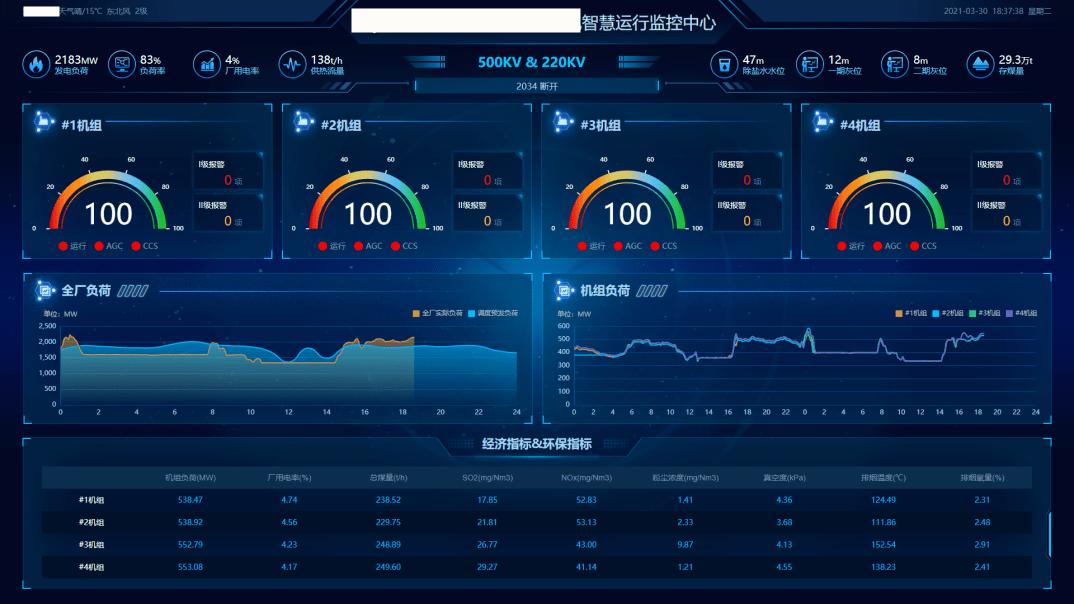
Data visualization is a process of presenting complex data in an intuitive form through visual elements such as graphics, charts, and maps. Data visualization aims to help people quickly extract useful knowledge from complex data and transform data into a form that people can quickly understand.
Data visualization is particularly important in today's information age. Faced with massive and diverse data, human beings' ability to analyze data has lagged far behind their ability to acquire data. Data visualization has emerged to help analysts better understand data, discover patterns and trends, and reveal the relationships and meanings behind the data.
Data visualization has a wide range of application scenarios, including but not limited to smart water conservancy, smart campus, smart factory, smart transportation, etc. For example, in smart water conservancy, data visualization is used in digital twin water conservancy solutions, which display monitoring results and support engineering safety analysis and decision-making through the integration of three-dimensional visualization charts and digital twin scenarios.
There are many types of data visualization, including scatter plots, line graphs, pie charts, bar graphs, heat maps, area graphs, value line graphs, histograms, etc. Each type of data visualization has its specific purpose and visual effects that help identify the problem.


Smart Data Visualization Platform-Function Analysis
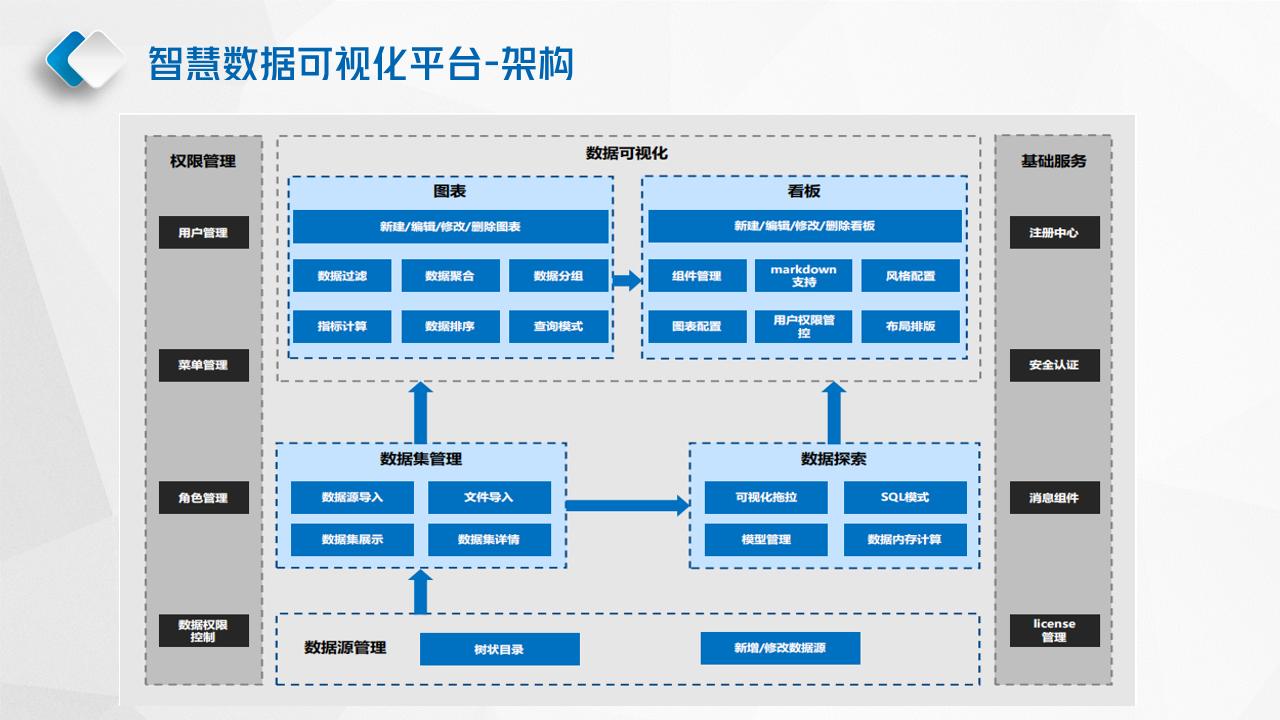
Data Source Management
Provides data access capabilities for various data sources, including mainstream databases, file data sources, IoT data, interface data sources, and file transfer agents.
Dataset Management
Register datasets to provide and manage unified and dynamic data sources for charts and data exploration based on business needs.
Data Exploration
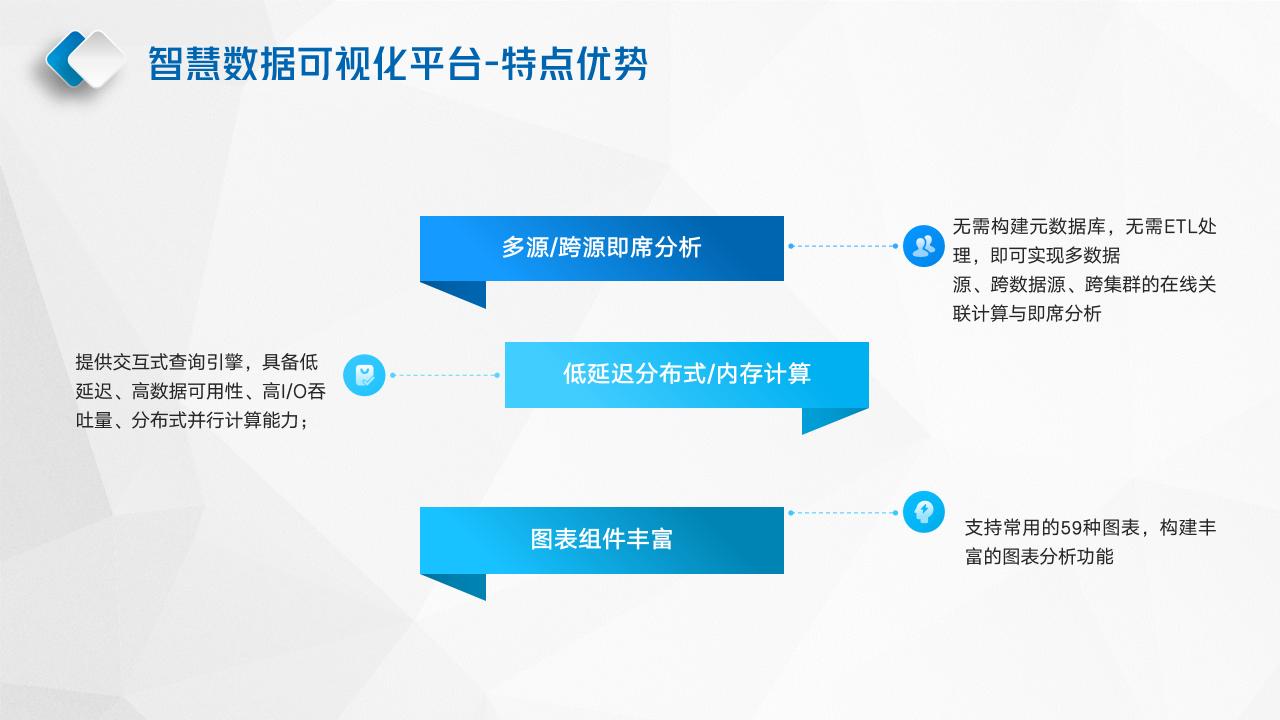
Perform association analysis and data model creation for the same or different database data sets based on interface development and SQL development modes
Chart Management
Create and manage various types of data charts based on a variety of chart templates and visual elements
Kanban Management
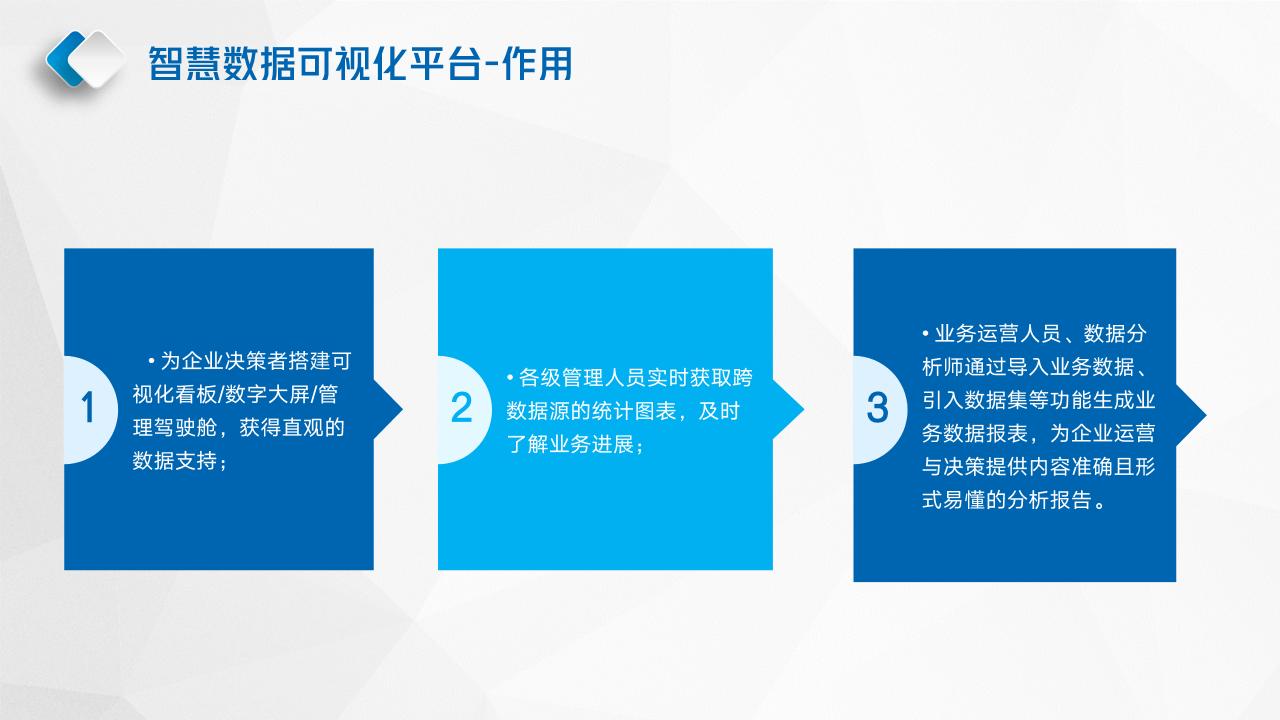
According to business needs, integrate various types of data and charts, define data display templates, create and manage data dashboards/digital screens.
Permission Management
Provides permission control configuration, supports permission management for multiple organizations and multiple roles, and resource permissions support row-level and column-level control.
Basic Services
It provides a number of basic functions to manage system information such as user registration, system security, messages, licenses, etc.


 EN
EN
 ZH
ZH


